
Effective Digital Campaign Building Tip #2: Setup End-to-End Analytics

Article type: Technical
Perfect for: Digital marketers that seek to improve
We have talked about how to set up a multichannel marketing campaign in our previous article. Now let’s talk about four key challenges to address to unleash holistic tracking of your campaign online and offline.
In this article:
- Tracking paid advertising channels
- Tracking offline advertising media
- Optimizing your website performance
- Streamlining the marketing process
Read below or watch the video:
Challenge 1: How to make sure all your paid ad channels are tracked correctly?
Tracking paid ads is important because this is where a lot of your marketing budget goes into, ergo you need to make sure all of them are configured correctly and bring the traffic on your website.
Paid ads include:
- Real Estate portals (for example, homegate.ch or www.acheter-louer.ch)
- Google Ads
- Google Display Network (banners on various websites)
- Facebook Ads
- MailChimp
- Etc.
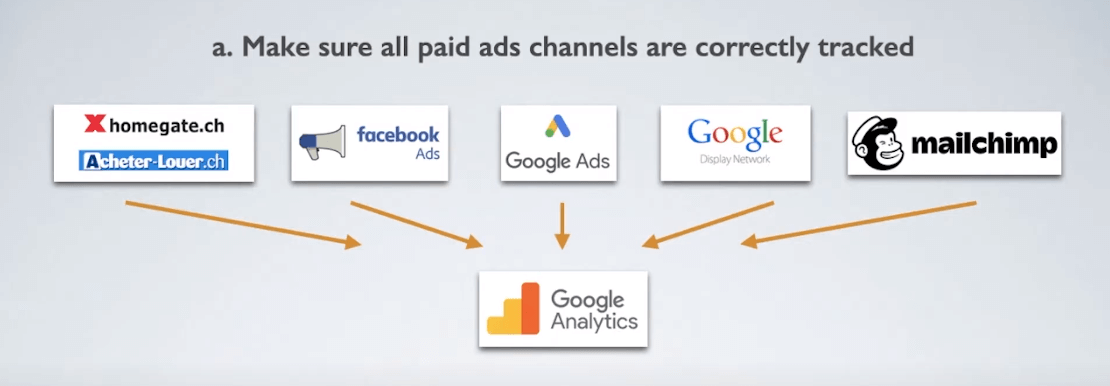
Tracking paid advertising media
How do you track them? One of the easiest ways is to have a Google Analytics account for your primary website. Besides the basic information about the visitors on your website, Google Analytics will show you:
- How many visitors come from which channel or medium
- Which channels work better than others
- Which website activities are most popular among your visitors. This can be tracked by setting up goals in the GA admin panel – for example, a reached goal might be a brochure download, filling out a contact form, or clicking a “Request meeting” button.
If you have banners on real estate portals or any other channels, it’s easy to track visits and conversions with the help of UTM tags.
UTM tag is an addition to your standard URL (web page address), for example, https://wild-dots.com/?utm_source=facebook&utm_medium=banner&utm_campaign=tip2_utm
If you look closer, you’ll notice the following parameters:
- The link to your website itself (in this case, https://wild-dots.com/)
- ?utm_source=facebook – source shows where the link was placed. In this example, it was a Facebook post that Wild Dots has posted on their page.
- &utm_medium=banner – what medium had been linked (could be a picture or a text link or something else). In this case, there was a picture banner (medium) in the newsletter (source.)
- &utm_campaign=tip2_utm – create a name that would be easy for you to identify what campaign brought you the visitors. In our example, it was a link for Tip 2.
Confused by all this code? Don’t worry – there’s a convenient Google UTM Generator tool that can take care of all of this. You simply fill out a form and get the link with all the ? and & included correctly.
Organic Google search
Besides paid ads, you should also analyze your organic search terms i.e. what people enter in the Google Search and find your website. The Google Search Console tool is helpful here – it shows you the number of visitors who got to your website from Google.
Why is this important? Well, if you have a real estate business called AveNew, but people find you by the term “Ave Maria lyrics”, something went wrong in your content strategy 🙂 But that’s a whole other topic about content marketing, which we will cover later.
Challenge 2: How to track offline marketing channels?
Online channels are relatively easy to track as opposed to offline ones. If someone, for example, sees your website address on a billboard, comes home, and enters it from memory – that visit will be counted as direct traffic, but you’ll have no idea where the customer came from (unless you ask later.)
So, let’s talk about two ways you can track your offline traffic.
Call tracking
- If you want to see how many people are interested in calling you – hide the number behind a little banner on your website with the phrase “Click to see the number.” Users who click to see the phone number are more likely to call.
- Purchase specific dynamic phone numbers and tie them to your primary one. For example, you can have one phone number to put on billboards, one for CPC, and third for your website. Tracking how many times those phone numbers are called gives you an estimate of what channel works better than the rest.
Domains: Similar to the method with call tracking, you can set up different domains for your primary website. For example:
- Newfancyproject.com – for online marketing (Facebook ads, Google ads, and Google display network, etc.)
- Newfancyproject.ch – for offline marketing (billboards or flyers)
Challenge 3: How to measure and optimize your website’s usability?
You’ve got people coming to your website, but now you need to make sure that your website design and structure are matching people’s expectations and the visitors know how to navigate around.
We recently published research on how the website menu affects user behavior – you can read it here. We used the Google Analytics data primarily for it, but there is another tool that is helpful to visualize people’s actions on the website: Hotjar.

Hotjar Heatmap Example
Hotjar provides a heatmap with clicks, information on how long the person spent on your website, etc. With its help, you can identify whether some areas of your website are getting less attention than you hoped they would and if pictures or buttons should be moved around for better navigation.
Challenge 4: How to make the measuring process more streamlined?
Tip 1: Every measuring and analytical tool we have mentioned above (Google Analytics, Google Search Console, Hotjar, etc.) have their own tracking codes. We recommend implementing them all with the help of Google Tag Manager (GTM).
This way, you install the GTM once on your website and then all the other codes can be added to GTM (which can be done by your marketing team without having to involve developers, saving you money and time.)
Tip 2: Along with tracking codes, every tool has its own reporting system. To avoid inconsistent data and a lot of manual repeating work, unify the report’s data. Google BigQuery is a tool that we use here at the Wild Dots, which collects all the reports into a single database.
These reports help us to be transparent with our clients and they can easily see the return on investment for every single channel and marketing effort. The campaign efficiency is also shown – how many emails, for example, did we capture, what was the user acquisition cost, etc.
Takeaways
Here are the main challenges we’ve covered in this article, summarized:
- Track as many data as possible (traffic sources, user sessions, target actions)
- Build data warehouse – combine collected information with CRM data and spent costs
- Use automated live reports (Google Data Studio, Power BI, Tableau, etc.)
Looking for a partner to set up analytics like this for your real estate project? Let’s get coffee! (We do like coffee a lot :))